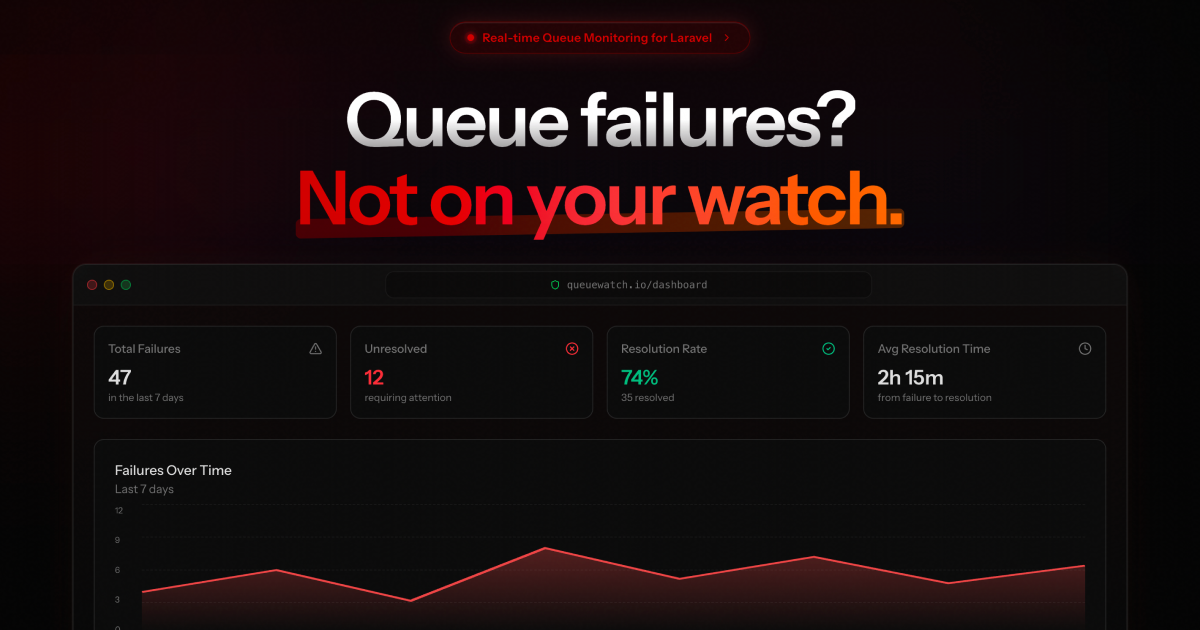

After years of working with Laravel queues, I've learned that the most dangerous failures are the ones you don't know about. Last month, I launched Queuewatch.io to solve this problem. Here's what I learned building a monitoring service for Laravel's queue system.
Laravel's queue system handles failures elegantly. Jobs retry automatically, failed attempts get logged to the failed_jobs table, and the system continues processing. But there's a critical gap: nobody gets notified when things go wrong.
Consider this scenario: Your payment processing job starts failing at 2 AM because a third-party API is returning 500 errors. Laravel dutifully retries the job three times, logs the failure, and moves on. Hours later, customers start complaining about missing receipts. You check the failed_jobs table and discover dozens of payment confirmations that never went out.
This reactive workflow costs time and damages customer trust. The solution isn't better error handling it's better observability.
Queuewatch sits between your Laravel application and your notification channels, monitoring queue failures and alerting you immediately through Slack, Discord, email, or webhooks. But it goes beyond simple alerts:
Instant Failure Notifications with configurable rules. Filter by environment, job type, or failure frequency. Critical payment jobs trigger immediate Slack alerts, while low-priority notifications get batched into daily digests.
Rich Exception Context captured at failure time. Full stack traces, job payloads (optional), server context, and Laravel-specific metadata. Debug faster without SSH-ing into production servers.
Remote Retry directly from the dashboard. No need to run artisan queue:retry commands. Click "Retry" and the job gets re-dispatched to your application.
Enhanced CLI with powerful filtering:
1# Filter by multiple criteria2php artisan queue:failed --queue=emails --after=yesterday3 4# Export as JSON for automation5php artisan queue:failed --json | jq '.[] | select(.exception | contains("Connection"))'6 7# Combine filters for precise queries8php artisan queue:failed --queue=payments --after="2025-12-01" --class=ProcessOrderBuilding Queuewatch required solving several interesting technical challenges. Here's how the system works under the hood.
Queuewatch installs as a Composer package that hooks into Laravel's queue failure events:
1composer require queuewatch/laravelThe package registers a Queue::failing() listener during service provider boot:
1namespace Queuewatch\Laravel; 2 3use Illuminate\Support\ServiceProvider; 4use Illuminate\Support\Facades\Queue; 5 6class QueuewatchServiceProvider extends ServiceProvider 7{ 8 public function boot() 9 {10 Queue::failing(function (JobFailed $event) {11 $this->app->make(QueuewatchClient::class)12 ->reportFailure($event);13 });14 }15}When a job fails, Laravel fires the JobFailed event. The package captures comprehensive context:
1public function reportFailure(JobFailed $event): void 2{ 3 $payload = [ 4 'job_id' => $event->job->uuid() ?? $event->job->getJobId(), 5 'job_class' => $event->job->getName(), 6 'queue' => $event->job->getQueue(), 7 'connection' => $event->connectionName, 8 'exception' => [ 9 'class' => get_class($event->exception),10 'message' => $event->exception->getMessage(),11 'trace' => $event->exception->getTraceAsString(),12 'file' => $event->exception->getFile(),13 'line' => $event->exception->getLine(),14 ],15 'attempts' => $event->job->attempts(),16 'max_tries' => $this->getMaxTries($event->job),17 'environment' => config('queuewatch.environment'),18 'project' => config('queuewatch.project'),19 'php_version' => PHP_VERSION,20 'laravel_version' => $this->app->version(),21 'hostname' => gethostname(),22 'timestamp' => now()->toIso8601String(),23 ];24 25 if (config('queuewatch.capture_payload')) {26 $payload['job_payload'] = $this->sanitizePayload(27 $event->job->payload()28 );29 }30 31 $this->client->post('/api/failures', $payload);32}One design challenge was balancing visibility with security. Job payloads might contain PII, API keys, or other sensitive data. Queuewatch solves this with multiple layers:
1. Payload Capture is Optional
1// config/queuewatch.php2return [3 'capture_payload' => env('QUEUEWATCH_CAPTURE_PAYLOAD', false),4];By default, payloads aren't captured. You only see that ProcessOrder failed, not the order details.
2. Sanitization Pipeline
When payload capture is enabled, sensitive fields get redacted:
1private function sanitizePayload(array $payload): array 2{ 3 $sensitive = config('queuewatch.sensitive_keys', [ 4 'password', 'api_key', 'token', 'secret', 'ssn', 5 'credit_card', 'cvv', 'private_key' 6 ]); 7 8 return $this->recursiveRedact($payload, $sensitive); 9}10 11private function recursiveRedact(array $data, array $keys): array12{13 foreach ($data as $key => &$value) {14 if (is_array($value)) {15 $value = $this->recursiveRedact($value, $keys);16 } elseif ($this->isSensitiveKey($key, $keys)) {17 $value = '[REDACTED]';18 }19 }20 return $data;21}3. Granular Ignore Rules
The configuration allows excluding specific jobs, queues, or exceptions:
1// config/queuewatch.php 2return [ 3 'ignored_jobs' => [ 4 App\Jobs\NoisyTestJob::class, 5 ], 6 7 'ignored_queues' => [ 8 'low-priority', 9 ],10 11 'ignored_exceptions' => [12 Illuminate\Database\Eloquent\ModelNotFoundException::class,13 ],14];This prevents alert fatigue from expected failures or noisy development environments.
Implementing remote retry required careful security consideration. The flow works like this:
The webhook validation uses HMAC signatures:
1public function verifyWebhook(Request $request): bool 2{ 3 $signature = $request->header('X-Queuewatch-Signature'); 4 $payload = $request->getContent(); 5 6 $expectedSignature = hash_hmac( 7 'sha256', 8 $payload, 9 config('queuewatch.webhook_secret')10 );11 12 return hash_equals($expectedSignature, $signature);13}This ensures that only authenticated requests from Queuewatch can trigger retries on your application.
During development, I hit several scaling challenges:
Challenge 1: API Rate Limiting
When a cascading failure causes hundreds of jobs to fail simultaneously, the package could overwhelm the Queuewatch API. Solution: Built-in batching and rate limiting:
1private function sendBatch(array $failures): void 2{ 3 if (count($this->batch) >= $this->batchSize || 4 $this->lastSentAt < now()->subSeconds(5)) { 5 6 $this->client->post('/api/failures/batch', [ 7 'failures' => $this->batch 8 ]); 9 10 $this->batch = [];11 $this->lastSentAt = now();12 }13}Challenge 2: Network Failures
What happens when the monitoring service itself is unreachable? The package uses a fire-and-forget approach with timeout protection:
1private function reportFailure(array $payload): void 2{ 3 try { 4 $this->client->timeout(2)->post('/api/failures', $payload); 5 } catch (Exception $e) { 6 // Never let monitoring failures break the application 7 if (config('queuewatch.debug')) { 8 logger('QueueWatch reporting failed: ' . $e->getMessage()); 9 }10 }11}Monitoring failures never disrupt your application. Failed reports are logged (if debug mode is enabled) but don't throw exceptions.
The Queuewatch dashboard is built with Laravel, Inertia.js, and React, the same stack I use for all my SaaS products. This allowed me to move quickly while maintaining type safety:
1// TypeScript interfaces for type-safe API responses 2interface QueueFailure { 3 id: string; 4 job_class: string; 5 queue: string; 6 connection: string; 7 exception: { 8 class: string; 9 message: string;10 trace: string;11 };12 attempts: number;13 max_tries: number;14 environment: string;15 failed_at: string;16 acknowledged: boolean;17}18 19// React component with full type safety20export default function FailuresIndex() {21 const { failures } = usePage<{ failures: QueueFailure[] }>().props;22 23 const retry = (failureId: string) => {24 router.post(`/failures/${failureId}/retry`);25 };26 27 return (28 <div>29 {failures.map(failure => (30 <FailureCard31 key={failure.id}32 failure={failure}33 onRetry={() => retry(failure.id)}34 />35 ))}36 </div>37 );38}Most teams run multiple Laravel applications: production, staging, and feature environments. Queuewatch handles this with a project/environment hierarchy:
Each installation gets tagged with project and environment identifiers:
1QUEUEWATCH_PROJECT=my-app2QUEUEWATCH_ENVIRONMENT=productionThe dashboard aggregates failures across all environments, with filtering by project, environment, or both. This prevents alert confusion when a staging deployment breaks temporarily.
The notification system uses a rule-based engine. You can create rules like:
Each rule matches against failure attributes:
1class NotificationRule 2{ 3 public function matches(QueueFailure $failure): bool 4 { 5 return $this->matchesEnvironment($failure) 6 && $this->matchesJobClass($failure) 7 && $this->matchesQueue($failure) 8 && $this->matchesFrequency($failure); 9 }10}This flexibility prevents alert fatigue while ensuring critical failures get immediate attention.
Queuewatch is live and monitoring queues for early customers. The roadmap includes:
Queuewatch is available now at queuewatch.io. The installation takes less than 5 minutes:
1composer require queuewatch/laravelAdd your API key to .env, configure notifications in the dashboard, and catch queue failures before your customers do.
The package is open source (MIT licensed), and the service offers a free tier for small projects. For Laravel developers tired of discovering queue failures hours too late, Queuewatch provides the early warning system your queues have been missing.
If you enjoyed this article, please consider supporting our work for as low as $5 / month.
Sponsor
Written by
Writing and maintaining @LaravelMagazine. Host of "The Laravel Magazine Podcast". Pronouns: vi/vim.